Public Markets
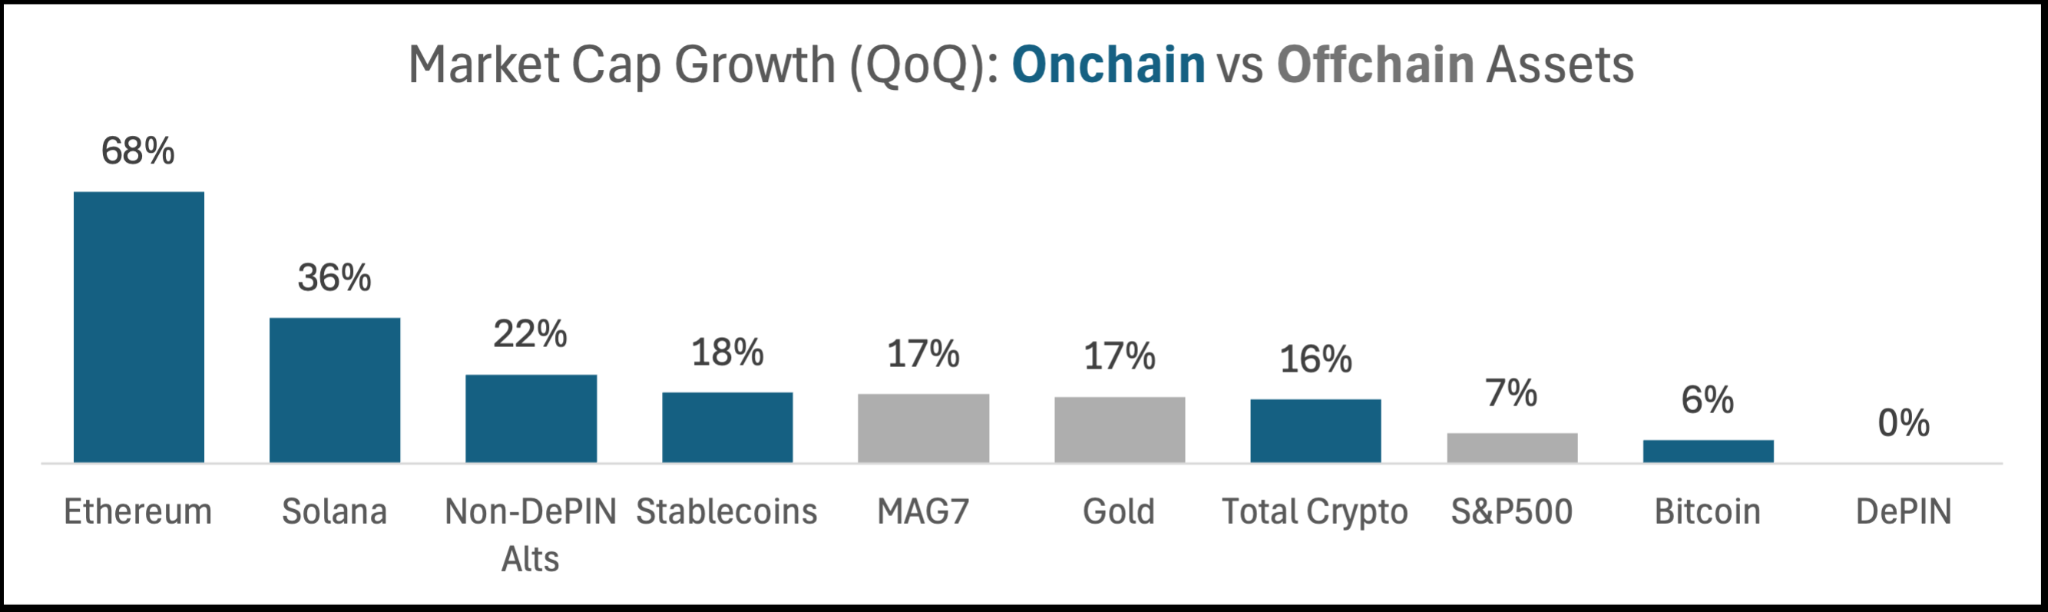
Crypto ended Q3’25 with a $4.0T market cap (+16% QoQ), matching the growth of other inflation-sensitive assets like the Mag7 and Gold despite a -5% pullback in the final two weeks of the quarter. Ethereum (+68%) and Solana (+36%) led the pack, adding +$200B and +$30B of new market cap, respectively. Bitcoin (+6%) and DePIN (+0%) faced challenging flow dynamics and lagged the market.
Source: Coingecko, CNBC, DeFi Llama, DePIN Pulse.
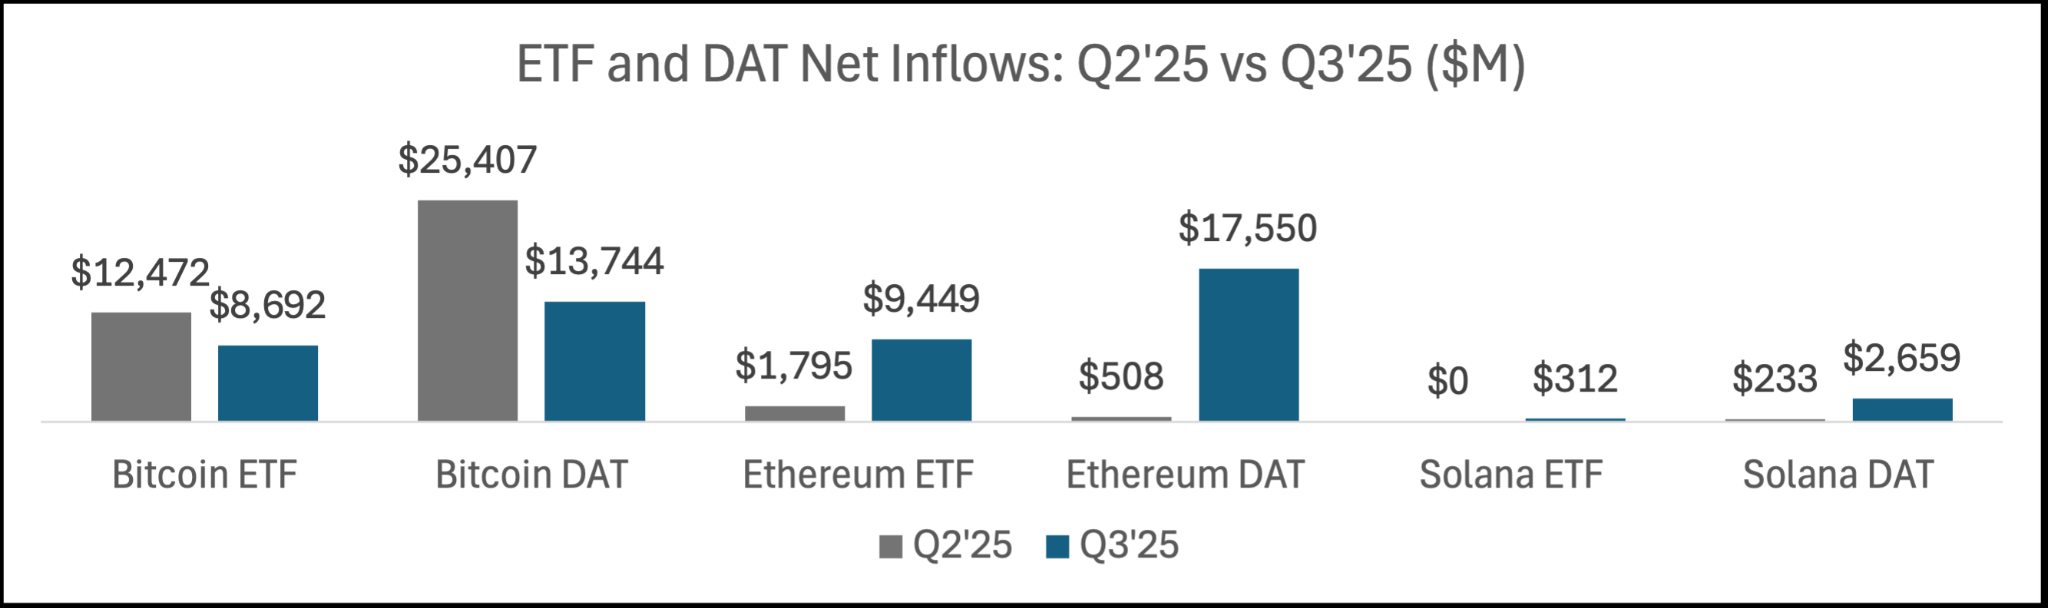
Retail investors remain largely on the sidelines since the political memecoins that captured a very brief moment of mainstream attention in January before declining -80-95% and erasing $7.5B of market cap. In the absence of retail, the biggest source of crypto flows today are ETFs and corporations that offer crypto exposure “wrapped” in traditional publicly traded entities. We refer to the latter as DATs, or Digital Asset Treasury companies. Combined, ETFs and DATs channeled over $52B of TradFi investor capital into Bitcoin, Ethereum and Solana in Q3 compared to $40B in Q2. Ethereum was the biggest winner, with inflows growing from $2.3B to $27B, which helped push ETH’s market cap from $300B to $500B.
Source: Farside, Blockworks, Coingecko.
DATs specifically are exploding not only in size, but also in number, breadth, and complexity. This quarter saw 100+ new DAT launches across 10+ different cryptoassets. DATs are beginning to differentiate their capital structure, asset selection, and yield generation, mirroring financial innovations of decades past like Business Development Companies in the 2000s and Bank Holding Companies in the 1970s.
In each case, two key ingredients, a newfound source of yield and a newfound source of leverage, combine to drive a cycle of boom, bust, and consolidation. In the 1970s, looser regulatory reserve requirements for BHCs allowed them to satisfy insatiable demand for international loans.2 In the 2000s, government-supported SBA/SBIC loans allowed BDCs to satisfy borrowing demand from millions of small businesses across the US. Today, thanks to the deep, liquid spot markets for their underlying crypto holdings, DATs are able to issue structured convertible and/or preferred securities and use the funds to buy and lend crypto, both onchain and offchain.
Rapid growth in the number of vehicles spun up to take advantage of the opportunity inevitably collapses spreads as borrowing becomes more expensive and lending becomes less profitable. When spreads compress, the weaker vehicles begin trading at discounts to book value and become prime acquisition targets for vehicles with stronger balance sheets. This is already happening today with DATs: per Blockworks data, the majority of DATs now trade at a discount to book value, up from only 20% last quarter. We recently saw the first large DAT M&A deal announced, and it’s likely we will see a double-digit number more before year-end.
Plain-vanilla M&A is a given, but we expect more complex financial maneuvering to emerge around DATs. DATs trading at a premium will use their stock to acquire DATs holding other cryptoassets and then swap the underlying exposure into their preferred asset. DATs will provide exposure not just to liquid tokens, but also private markets by participating directly in pre-mines alongside founders and VCs. Distressed and subscale DATs will lock tokens for long periods of time, jeopardizing their own duration profile as a poison-pill defense against aggressive acquirers. The biggest DATs, once they acquire sizable portions of circulating supply, will exert their influence on ecosystems either explicitly or implicitly. Project founders will begin leading DATs themselves rather than leave the privilege to promoters. Regulators will hopefully step in to prosecute the most egregious cases of insider trading, creating a fairer environment for investors. Given their increasingly important role in driving crypto flows, we believe it’s important to deeply understand the DAT landscape and its impact on our venture portfolio. Mahesh recently joined the Board of Directors at Strive, the investment firm cofounded by Vivek Ramaswamy and Anson Frericks, to help guide a $1B+ BTC treasury strategy.
Onchain Rates (Stablecoins)
Though we’ve mostly written to you about crypto price performance in the past, we spend an equal amount of time internally understanding onchain yields. In 2021, I remember lobbying for Ribbit to hold a portion of its stablecoin reserves in Aave’s then-new institutional platform. Unfortunately, Aave was yielding 2.5% at the time while a bare-bones smart contract insurance policy cost 3.5%. The policy would have insured us against hacks in the Aave smart contracts, but not against other tail risks like the protocol becoming undercollateralized, our stablecoin depegging, or a wallet hack. For the privilege of taking those risks, we would have earned a whopping -1.0% annual return.
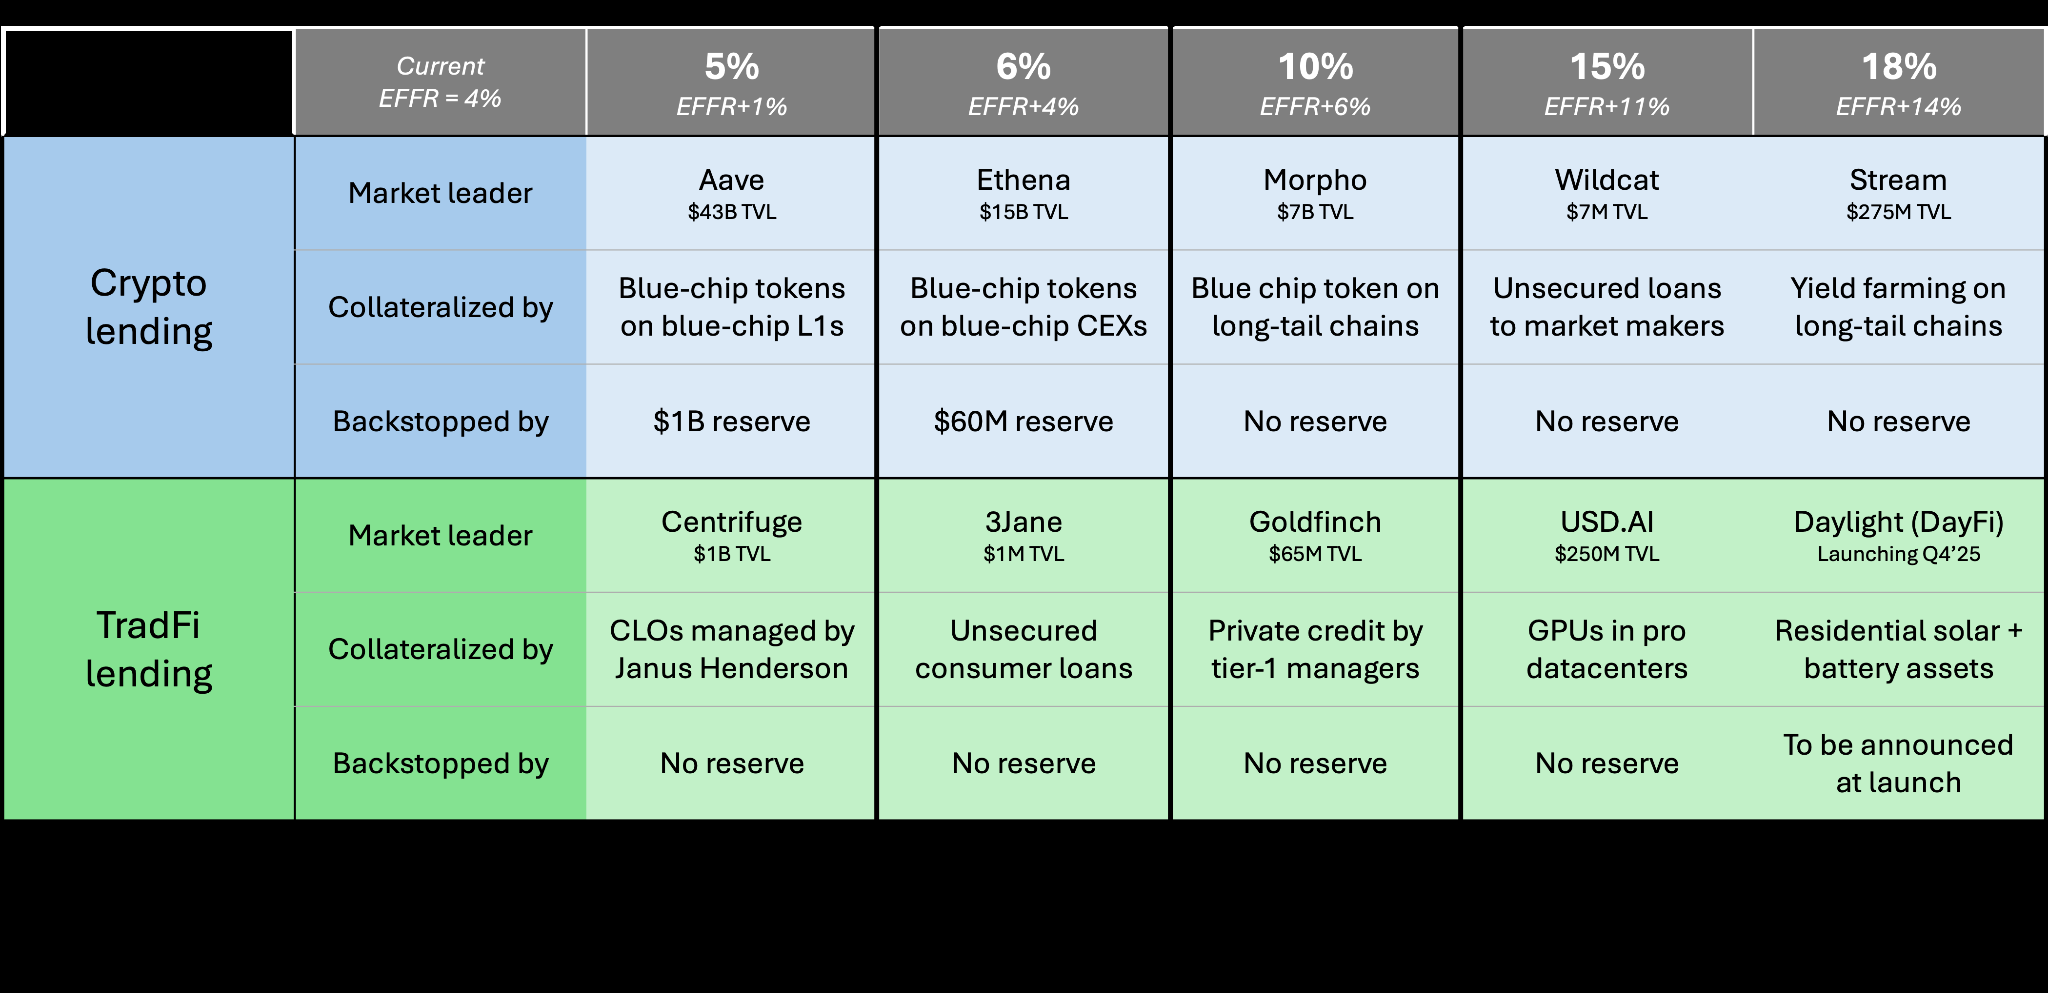
Today the situation is much different. Smart contracts have empirically gotten much more secure.3 Equally as important, there is now an increasingly diverse and sophisticated set of borrowers and risk profiles available to lend to, far beyond last cycle’s primarily crypto-native borrower base. Stablecoin holders today can earn anywhere from 5% to 18% yields lending to both crypto and TradFi borrowers directly onchain. Due to the composable and instantaneous nature of cryptoassets, strategies can be stacked on top of each other in recursive loops for levered yields as high as 25%+. High-yielding strategies grow extremely quickly: Plasma’s launch last week has already attracted $5B of AUM (TVL), and Ethena grew to $15B+ TVL in less than two years, faster than any offchain credit product we’re aware of.4
The flipside of hyper-growth is that yields for any individual strategy compress faster and systemic risk across the entire system builds up faster than in TradFi.5 As spreads compress, levered capital rotates out of one strategy to seek higher-yielding opportunities elsewhere or simply closes its position. In the case of crypto-collateralized stablecoins like Ethena, this reduces the value of the underlying collateral backing, which in turn reduces the market cap of the native token, the most junior tranche in the cap stack. The tail-risk scenario is a Terra-like bank run where the “stablecoin” depegs in the face of mass redemptions while its collateral token faces a hyper-inflationary spiral. There are now better liquidation safeguards in place than in 2022, but at the same time the number of stablecoins has grown from dozens back then to 170+ today.6 These are fragmented across exchanges, blockchains, and money markets, each with its own liquidity chokepoints, like a set of dominos where breaching a key level in one stablecoin can set off a chain reaction of programmatic liquidations across crypto.
The key to mitigating this risk is providing access to many different types of uncorrelated yields onchain. Over the past year we’ve seen entrepreneurs step up to fill this gap, tokenizing debt instruments backed by assets as far ranging as employee payroll, venue ticket advances, video game studios, consumer credit scores, vendor receivables, SMB revenues, AI compute, integrated solar and battery assets, and more. These protocols will serve as the safety valve for yield-seeking onchain capital as speculative demand to borrow crypto decelerates. The best among them will figure out the real-world scaling constraints needed to grow their credit book responsibly while swallowing up billions of dollars of inflows from stablecoin lenders around the world.
Source: DeFi Llama, EV3 analysis.
Onchain Rates (Native Assets)
So far we’ve discussed stablecoin lending, but most crypto loans are actually denominated in native L1 cryptoassets like BTC, ETH, and SOL. Unlike stablecoins where inflation is an exogenous factor influenced by the Fed, benchmark rates for native cryptoassets are determined by the staking policies and economies of each network. Here is a high-level summary of onchain rates as of September 2025:
A few takeaways
- Borrow-stake spreads are positive on Ethereum (0.3%) but negative on Solana (-0.1%). The main reason is that ETH staking carries both principal (slashing) and duration (unstaking queue) risk, whereas SOL staking carries only duration risk since Solana has not yet instituted slashing. The secondary reason is that there is significant demand to borrow and deposit SOL into DeFi pools with yields 200-400bps higher than staking, which pushes borrowing rates above staking rates.
- While inflation is important to take into account, dollar flows are ultimately what drives prices. At current rates and prices, Solana mints $5B of new SOL on an annualized basis, but Solana DATs and ETFs bought $3B worth of SOL in the last quarter alone, outpacing run-rate inflation, though it’s unclear what portion of DAT holdings are purchased from circulating vs locked tokens.
- Today, roughly 9.5% of SOL is locked in DeFi protocols vs 17% of ETH per DeFi Llama data. As Solana DATs scale and deploy their assets into DeFi, we expect these two numbers to converge. Correspondingly, it’s likely that borrow and earn rates on Solana fall closer to Ethereum today as the pace of DAT inflows surpasses the rate of Solana DeFi’s underlying revenue growth.
- On the flip side of the point above, DAT inflows into Solana DeFi protocols will deepen liquidity and allow for much of the yield-seeking capital on Ethereum to bridge over. For example, if you wanted to borrow $1B of ETH on Aave today you would push borrow rates from 1.5% to 2.5%. If instead you tried to borrow $100M of SOL on Kamino, borrow rates would rise from 7% to 32%. The lack of liquidity keeps whales on ETH despite higher-yielding opportunities on Solana.
As you all know, there are two components of staking yields: organic economic activity driven by fee-paying onchain applications, and inorganic inflationary subsidies in the form of block rewards. In order to better understand the former, it’s helpful to zoom out for a broader perspective on crypto’s margin pools.
Onchain Profit Pools
We use Blockworks and DeFi Llama monthly data for September 2025.
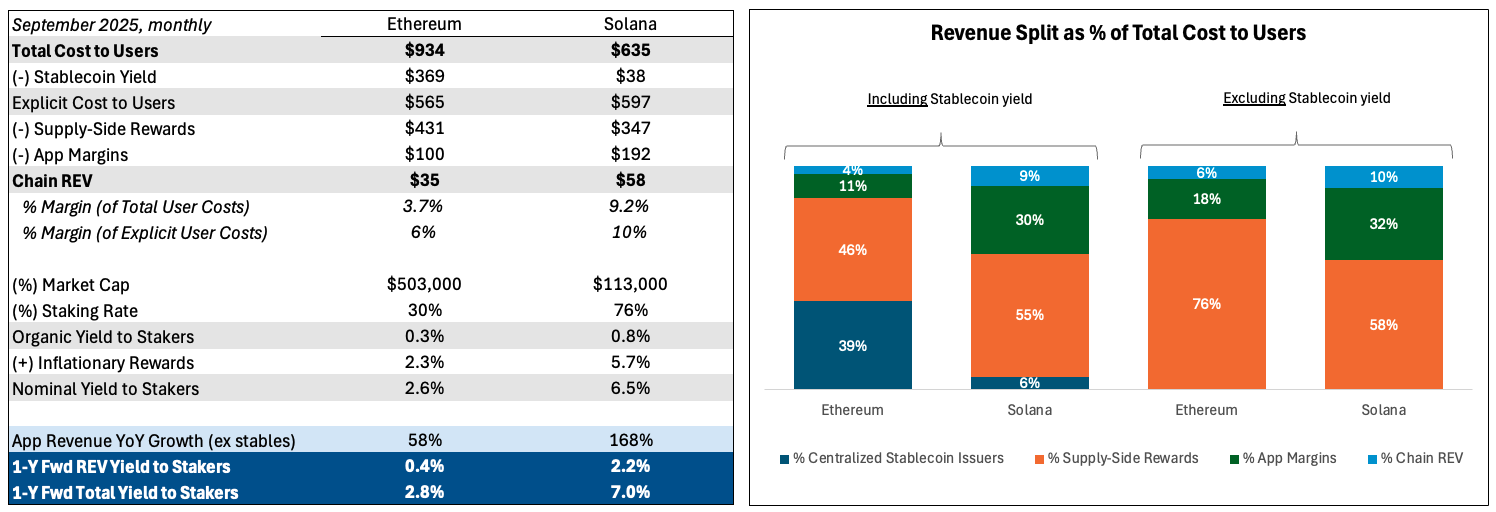
In September, users spent $1.2B to use apps on Ethereum and Solana.7 Of this amount:
- Two-thirds ($780M) was redistributed back to users in the form of supply-side rewards.
- A quarter ($290M) was earned as a margin by apps.
- The remainder ($93M) was earned as a margin by L1 blockchains.8
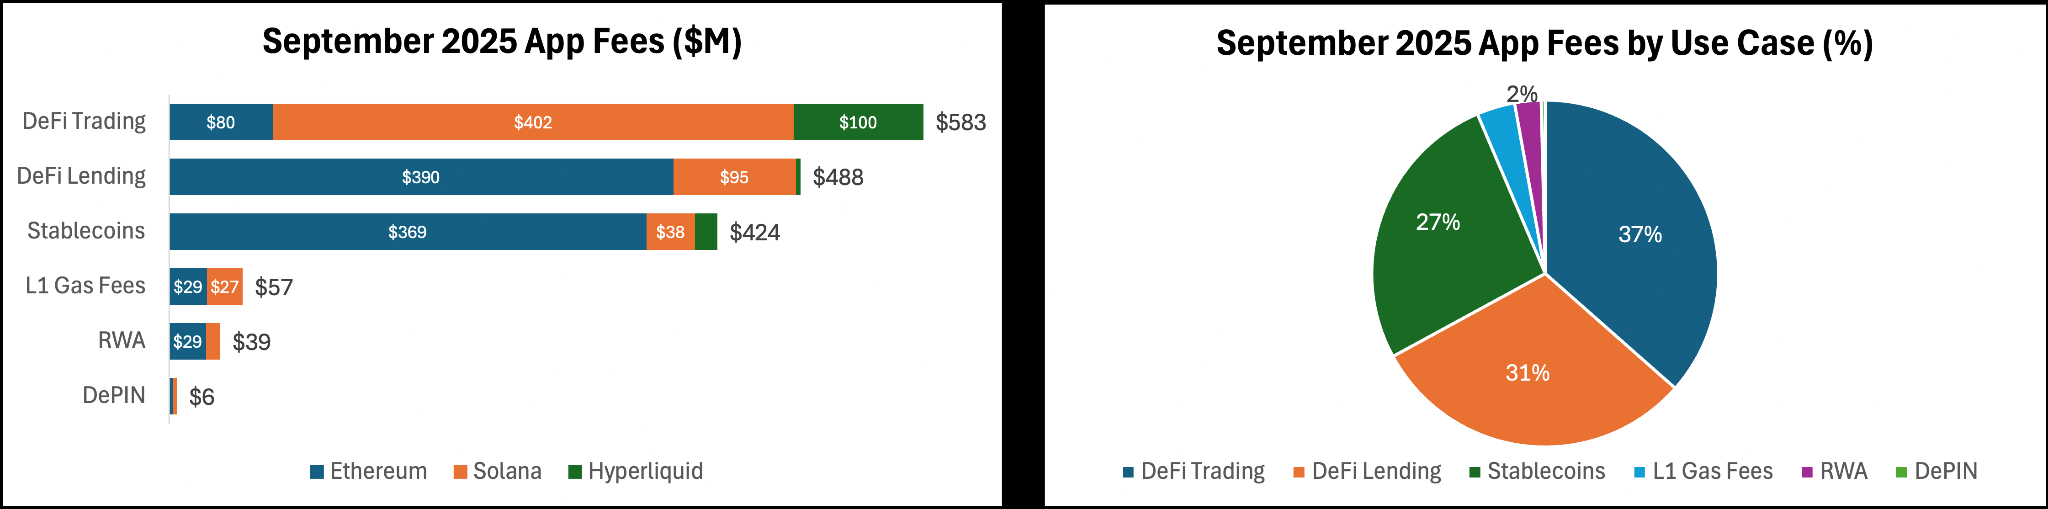
Source: Blockworks, DeFi Llama, EV3 analysis.
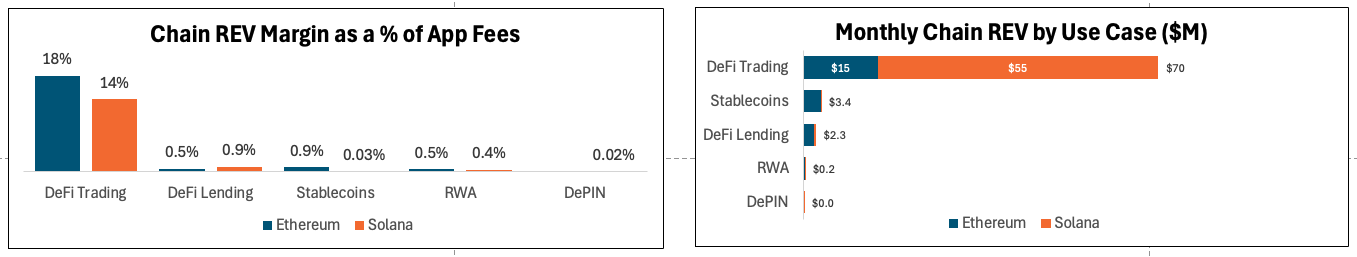
Despite the differences in culture and performance, both chains earn a similar margin between 6% and 10% of total revenues, excluding stablecoins. Based on current market caps and staking rates, this level of onchain activity supports an organic real staking yield of 0.3% for ETH and 0.8% for SOL. The most interesting data is highlighted in dark blue. On the left, if you believe crypto usage will continue to grow at the rate it has in the past year, staking SOL today delivers a one-year forward organic yield of 2.2% or 7.0% nominal. These yields are not paid in politician-controlled fiat currencies, but in self-custodial assets that provide access to an always-on global permissionless ledger and have been among the top performing assets anywhere in the world for the past decade.
On the right, you’ll notice the distribution looks similar only when excluding centralized stablecoin issuer revenues. These are implicit costs borne by users in the form of foregone yield. The two biggest issuers, Tether and Circle, earned $405M in September from stablecoins on Ethereum and Solana, which is more than apps and blockchains made combined. Low fees on Solana drive faster trading velocity, which means fewer stablecoins are needed to sustain a similar level of activity, so stablecoin issuers take only 6% of revenue on Solana vs 39% on Ethereum. With Circle trading at a $30B valuation and Tether raising at $500B, the market is signaling that internalizing stablecoin margins represents the biggest and fastest lever for improving chain margins.
Hyperliquid kicked things off with a governance battle for its native stablecoin ticker between nine bidders including leading DeFi protocols and centralized crypto companies. Solana’s ecosystem leaders subsequently raised the possibility of internalizing stablecoin economics. Last week, Plasma, a new L1 blockchain affiliated with Tether where gas can be paid with USDT, launched a token valued at $10B FDV. Both Circle and Stripe also recently announced stablecoin-focused L1s. It’s becoming inevitable that stablecoin and L1 blockchain economics converge as L1s seek to expand their margins. After the low-hanging fruit of internalizing stablecoin economics, growing staking yields requires sustained growth in economic activity on top of L1 blockchains. DeFi alone represents two-thirds of total app fees, or 95% if you also include stablecoins. RWAs, DePIN and social apps make up most of the last 5%.9
Source: DeFi Llama, EV3 analysis.
These dapps have vastly different margin profiles for the underlying L1 chain. While the data here is a bit messy, below is our best estimate for the breakdown of chain earnings by use case.10 DeFi trading is far and away the most profitable activity for L1s, with the underlying blockchain earning 14-18% margins on every dollar of fees paid by users vs less than 1% everywhere else. This is the reason we remain skeptical of vertically focused blockchains specializing in DePIN, intellectual property, or RWAs: blockchains are asset ledgers at the end of the day, so it’s no surprise that trading, creating and moving entries around in the ledger, is the highest-margin use case in both dollar and percentage terms. We expect vertical-focused blockchains, particularly those serving low-velocity use cases, will have a structurally worse margin profile than general-purpose or trading-focused L1s.
Source: Blockworks, DeFi Llama, EV3 analysis.
Ethereum and Solana combined made $93M in earnings in September, capturing 8% of the total $1.2B paid by users, or 6% if including stablecoin yield. The two new breakout chains of this cycle have done so by enshrining a key application and internalizing its economics into the L1, namely perps trading on Hyperliquid and stablecoins on Plasma. The former generated $105M of trading fees in September; the latter attracted $5B of deposits in its first week post-launch, implying $15M of monthly interest income.
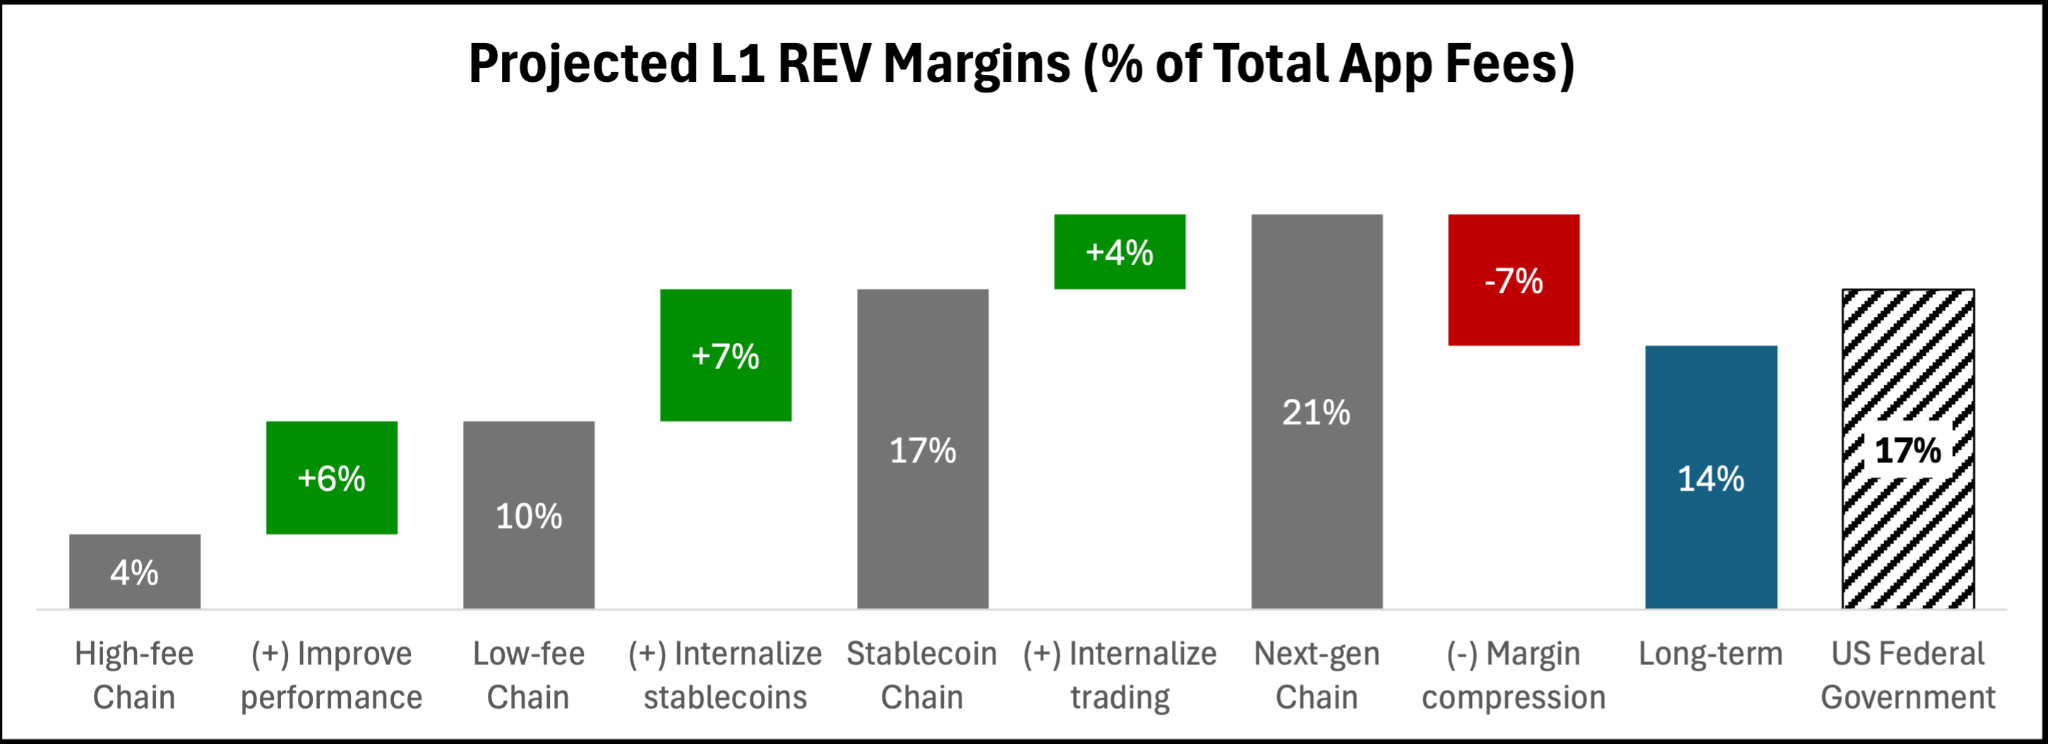
L1 blockchains generate 6-8% margins today, but what long-term margin are tokenholders underwriting? Ethereum, given relatively high fees and low trading velocity, captures 4% of revenues for the L1.11 Low-fee blockchains like Solana capture a 10% margin due to a higher velocity of trading. Internalizing stablecoin yields could drive another seven points of margin expansion, and internalizing trading revenues another four, for a total margin of up to 21%.12 However, this is a highly optimistic scenario: it assumes the winning L1s capture market share from competitors without pressuring margins. More realistically, we estimate margins will fall by a third across the board as blockchains compete for users, developers and liquidity with mechanisms like MEV refunds or passing on stablecoin yield. Longer term, we believe L1 margins will stabilize in the mid teens, roughly in line with the US federal government’s margin on GDP.
Source: Blockworks, DeFi Llama, EV3 analysis.
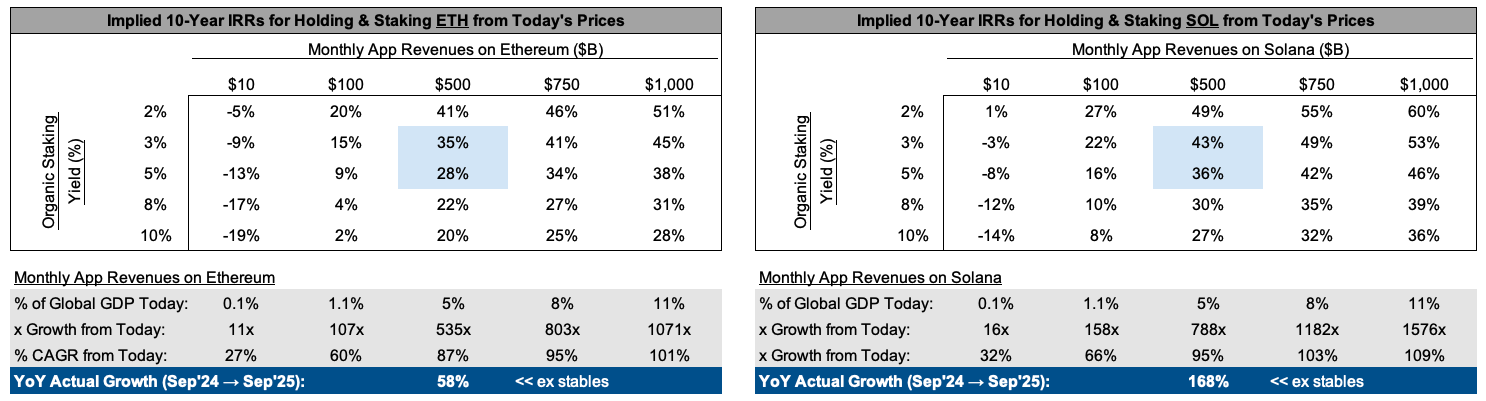
What does this imply about L1 cryptoasset valuations today? If you believe that:
- The leading L1 ecosystem will grow 500x+ over the next decade to settle 5% of global GDP.
- The leading L1 will sustain 15% margins long-term by internalizing stablecoins and trading.
- The leading L1 will be valued at a 3-5% real staking yield, roughly in line with the S&P 500.
Then you can compound your money at 30% staking ETH and 40% staking SOL at today’s prices.
Source: EV3 analysis.
This math attracted $30B of TradFi investor capital into Ethereum and Solana ETFs and DATs in Q3.
DePIN
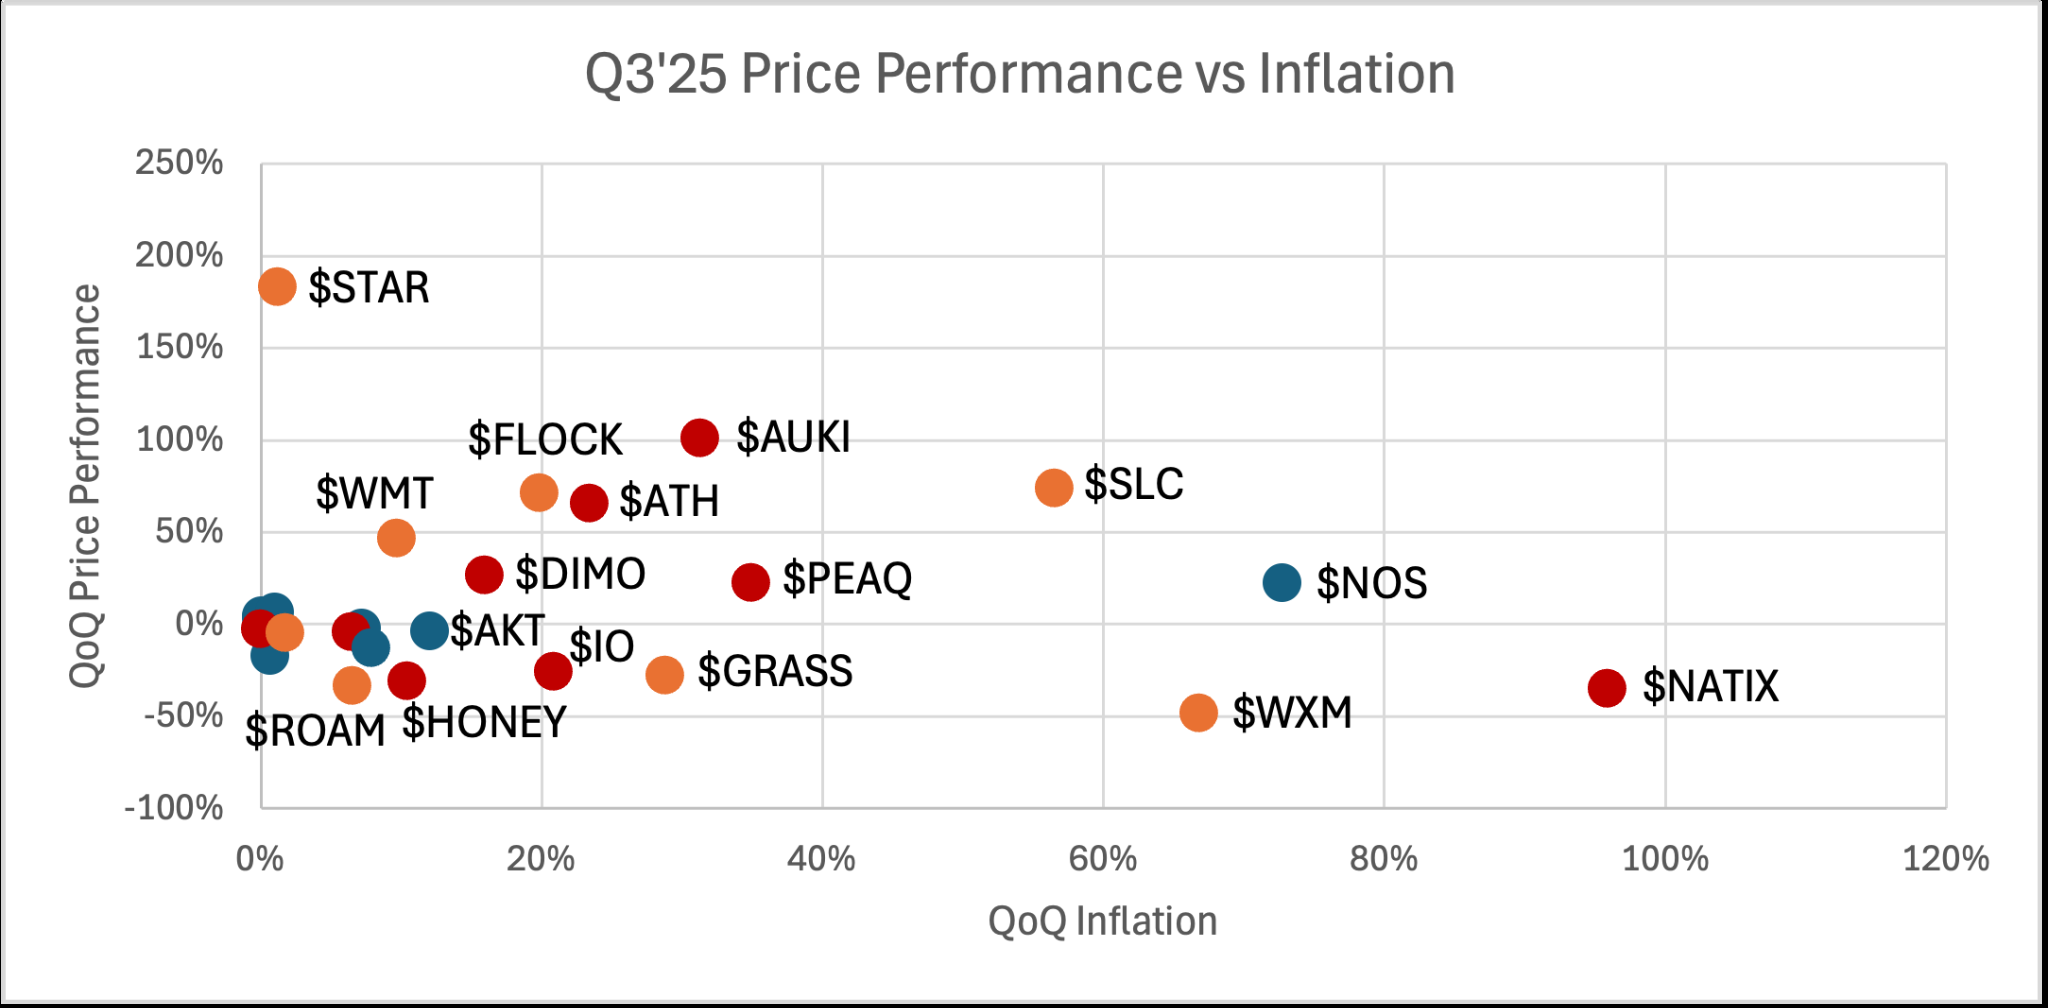
Overall DePIN market cap was flat this quarter. Unlike in quarters past where a certain pattern dominated quarterly performance, DePIN price action was all over the map in Q3’25. A few notes:
- “Robotics tokens” did well, with the handful of networks with real or perceived exposure to robotics growth being the sector’s biggest quarterly winners: Auki (+101%), Silencio (+74%), Over the Reality (+65%), Dimo (+27%), and Peaq (+22%). A cohort of new venture-backed robotics projects are set to launch tokens next year, after which the market will be forced to become more discerning as to which robotics tokens get bid. Despite the broader category doing well, autonomous-vehicle-focused networks underperformed with Natix (-35%), Hivemapper (-31%) and Rover (-3%) all declining amidst ongoing or upcoming unlocks.
Source: Coingecko, EV3 analysis.
- Markets are (sometimes) willing to overlook near-term inflation. Every DePIN token that rose more than 50% in Q3 is currently or will shortly experience inflationary shocks from insider token unlocks. Meanwhile, Helium became the first ever deflationary DePIN after more than tripling its onchain revenues, yet HNT price moved only +7% QoQ. While tokens facing insider unlocks were some of the best performing tokens of the quarter, they were also some of the worst. This reminds us of the market dynamics back in early 2024: many of the VCs that invested in private and OTC rounds based on borrowed conviction are now starting to unlock and are selling into a market with few buyers. At the same time, tokens that have already worked through insider sell pressure are grinding slowly upwards on thin trading volumes, where the primary buyer is the protocol itself through revenue-funded buybacks. Interestingly, just like in early 2024, fair launches are back in style, this time with development costs funded by foregone yield rather than trading fee taxes.
Source: EV3 Q1 2024 partner letter.
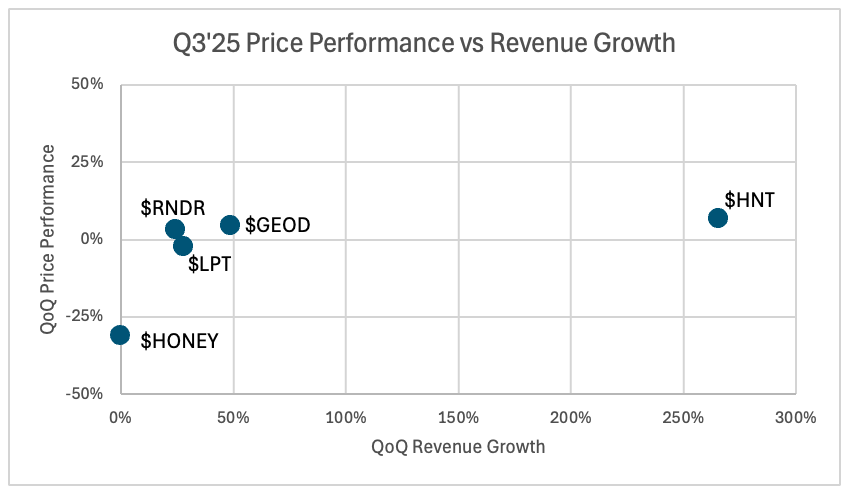
- Markets are discounting the durability of DePIN revenues. The two networks with the highest revenue growth in both dollar and percentage terms, Helium (+265% QoQ) and Geodnet (+50% QoQ), were not rewarded for their growth: HNT rose +7% QoQ and trades at a 27x multiple, and GEOD rose +5% QoQ and trades at a 25x multiple. Extrapolating recent growth out a few quarters brings these multiples down to mid-single digits, which we can only take to mean that the market does not believe that Helium and Geodnet’s revenue growth is sustainable. In the case of Helium, +265% QoQ growth was an anomaly driven by a one-time accounting change.13 However, even on a like-for-like accounting basis the network still grew revenues by +57% QoQ. While the market has lost faith in DePIN, we now have two examples of networks with multi-year track records of growing onchain revenues and returning capital to tokenholders via buybacks, currently growing 50%+ QoQ and trading at prices that give little to no credit for future growth.
Source: Coingecko, DePIN Pulse.
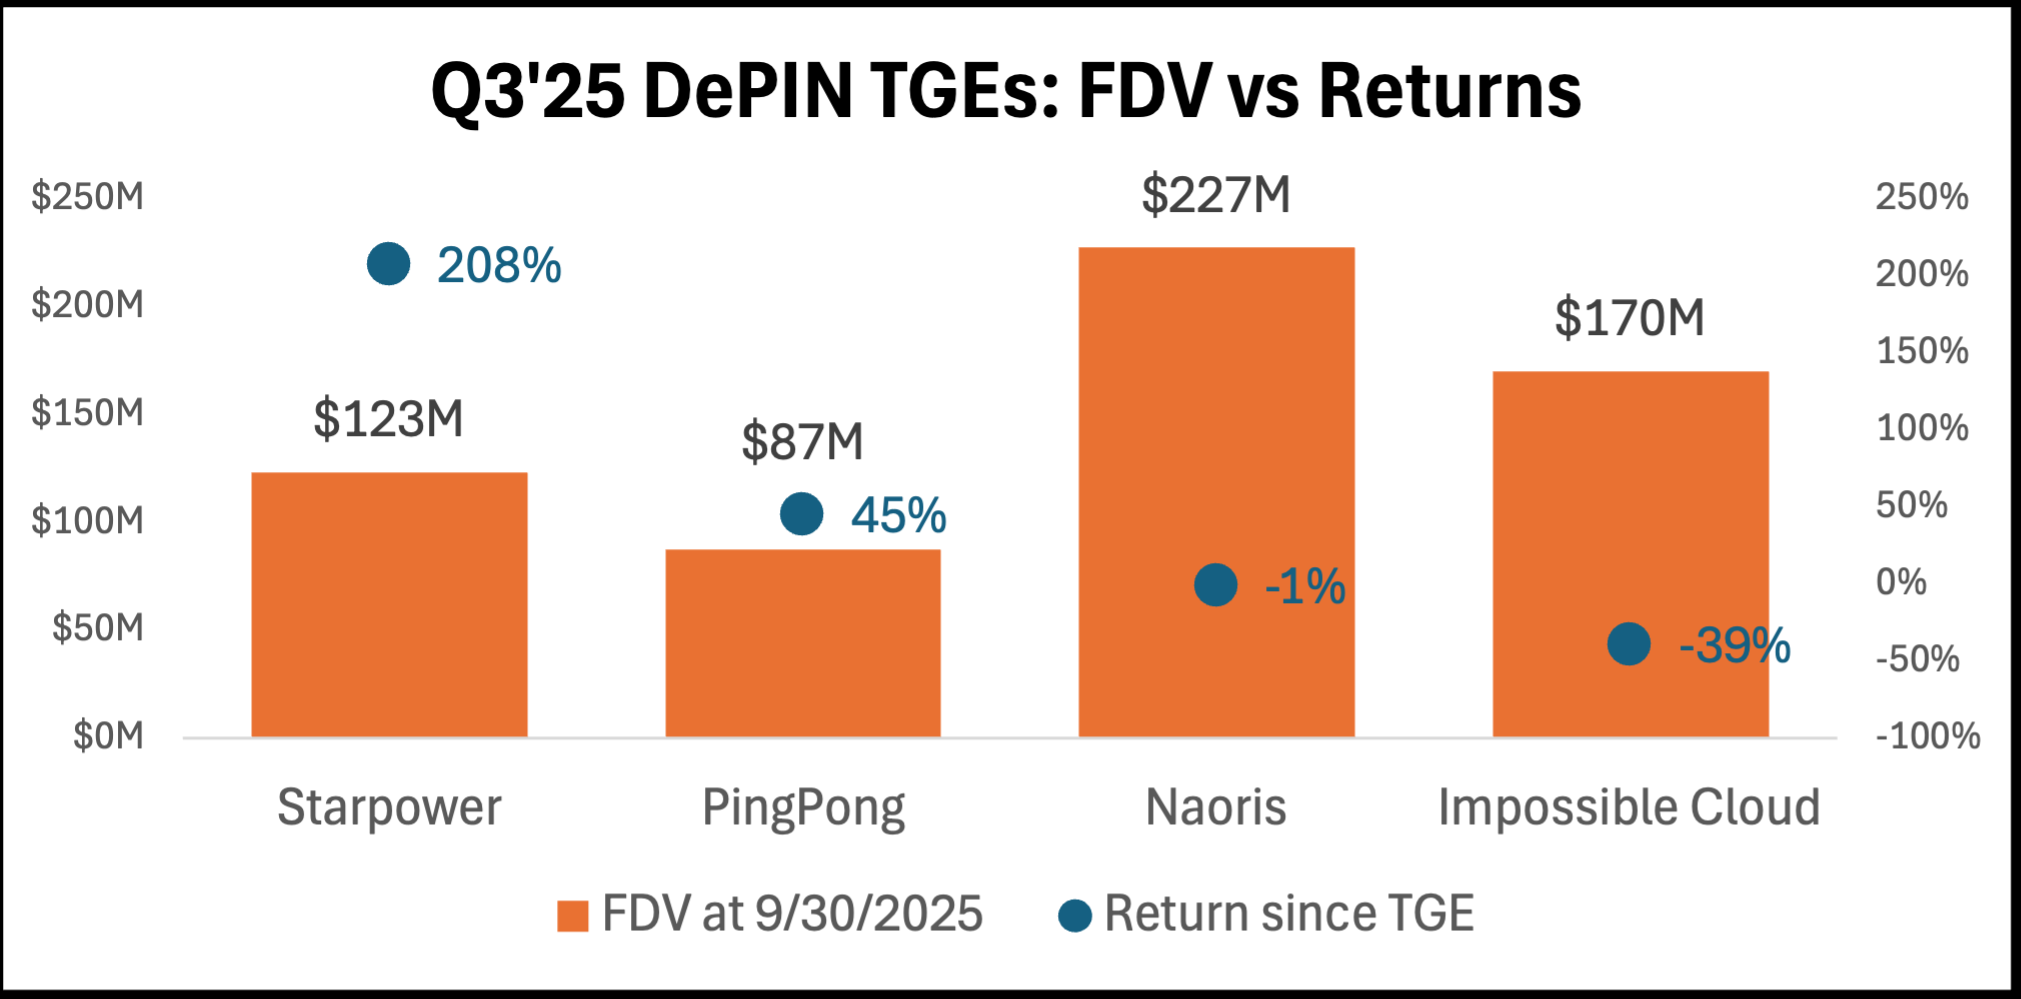
- The DePIN TGEs window is open at $100-250M FDV. However, no one has managed to pull off a large-cap, $1B+ FDV listing since the first quarter. DePIN token launches this quarter include Starpower in energy, Naoris in quantum computing, Impossible Cloud in cloud computing, and PingPong in mining, all trading at low nine-figure FDVs at quarter end. Tokens that initially listed at under $100M have traded up, and those that listed at under $250M have traded down, suggesting this is roughly the market price for DePINs that built supply but have yet to post onchain revenues.
Source: Coingecko, EV3 analysis.
While we seek to understand market behavior on a quarterly basis, our own time horizon is measured over multiple years. This allows us to take advantage of dislocations like the ones we believe exist today, where n-of-1 businesses in massive global markets trade at single-digit multiples of their one- to two-year forward onchain earnings. The best investors we know made their money from having a differentiated view on the durability of growth in a small number of businesses that compound over an unusually long period of time. Our long-term conviction in DePIN stems from the belief that several such compounders will be built here.
Fin
As many of you know, we are power users of augmented reality here at EV3. This quarter we had the opportunity to share a bit of our obsession with you via our first foray into building an app for AR headsets. We are beyond excited for the next phase of EV3 and grateful to have all of you alongside us.

Your partners,
Sal & Mahesh
Notes
George Soros wrote the following about the “International Debt Problem” of the 1970s. It rings familiar today: “The main corporate trend was the formation of bank holding companies. The change of format allowed additional leveraging at the holding company level so that the ratio of capital to total assets continued to deteriorate… It was also a time of rapid technological innovations. The use of computers speeded up activities and permitted operations that would have been previously inconceivable. Many new financial instruments and financing techniques were invented and banking became a much more sophisticated business… The task of the regulators was complicated both by the pace of innovation and by the international character of the competition. It is not unfair to say that the regulators were always lagging a step behind the practitioners and the industry became adept at finding a way around whatever regulations were imposed.” Alchemy of Finance, Chapter 5. ↩
A high-value smart contract hack in 2025, especially after several years of declining losses, would be even more likely to cause an exogenous shock on onchain cost of capital and trigger systemic deleveraging across crypto. ↩
Owl Rock hit a similar level after 3 years (2016-2019) and has since scaled to $285B AUM. ↩
Ethena’s yield fell from 19% in 2024 to 6% today, versus a 5.6% borrowing cost on Aave, even after subsidies from ENA token inflation. Plasma’s Aave pool was yielding over 40% at launch on September 25 and had declined to 8% by September 30. ↩
This includes only USD-denominated stables. The total number of stablecoins is over 200. ↩
Per DeFi Llama data. Includes data for the top 80 fee-generating apps on Ethereum and top 50 on Solana. ↩
This amount includes the explicit fees paid by users and the implicit arbitrage profits extracted from user transactions in the form of MEV. It does not include the implicit costs of foregone yield for users holding centralized stablecoins. ↩
Represents a percentage of $1.6B spent across Solana and Ethereum app fees ($1.1B), Hyperliquid trading fees ($105M), and centralized stablecoin issuer revenues across the three aforementioned chains ($425M). ↩
These figures require making assumptions as to what percentage of REV is attributable to “native” chain functions. ↩
L1 earnings or REV are distributed across stakers via MEV tips and all tokenholders via burn. We are primarily discussing the opportunity cost of staking native assets and therefore treat REV as the core earnings metric to underwrite from. ↩
Low-fee chains like Solana already capture a substantial portion of DeFi trading fees via MEV, therefore the margin uplift from internalizing trading is relatively smaller than internalizing stablecoins. ↩
The nature of the accounting change is that Nova Labs began reflecting its non-data-offload-related revenues, such as the reselling of user location or connectivity data, in the onchain revenue figures. We call it an accounting change rather than a structural one because the tokens being burned are coming from the Helium Foundation balance sheet, not open-market buybacks. ↩